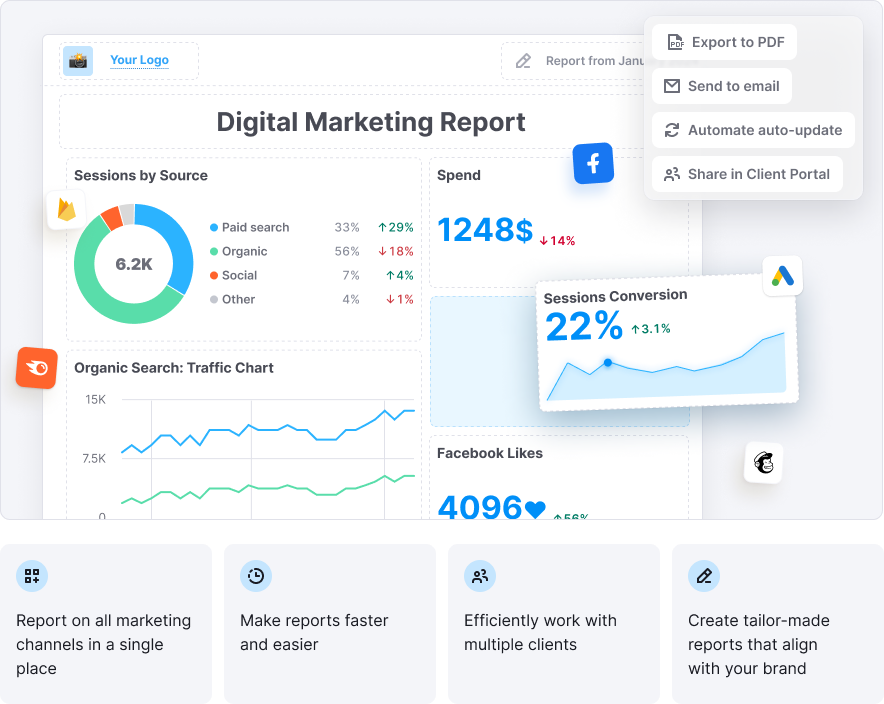
My Reports helps you consolidate data from Semrush and 20+ top marketing tools into fully customizable, professional-grade reports. Track performance, drive better decisions, and showcase the value of your work—all in one place.
The all-in-one marketing reporting solution for teams and agencies.
Who Is It For?
Digital agencies
Deliver polished, white-labeled reports that wow your clients. Automate recurring updates and summarize insights with AI—all branded to your agency.
In-house marketing teams
Keep teams aligned and stakeholders informed with real-time data from across your marketing stack. Present performance trends with ease and clarity.
Tiers and Pricing
Flexible, pay-as-you-go reporting—choose the features you need.
Each report is purchased individually and billed monthly.
Base report$10Monthly per report
|
Pro report$20Monthly per report All features from the Base report plus:
|
Limits
Paid Semrush Toolkits
- When you purchase your first paid Semrush toolkit, your subscription includes 3 Base reports.
- Each additional paid toolkit adds 2 more Base reports to your total.
- Reports are cumulative.
Example:
If you subscribe to both the SEO Toolkit and the Traffic & Market Toolkit, you receive 5 Base reports total:
- 3 reports for your first paid toolkit
- 2 additional reports for your second paid toolkit
Note: For the Local Toolkit, purchasing additional locations does not increase your Base report limit.
App Center
- If you purchase apps from the App Center only (without a paid toolkit), you receive 1 Base report, regardless of how many apps you purchase.
- If you later purchase a paid toolkit, your Base report limit will follow the paid toolkit rules described above.
Free Plan
- Free plan includes 1 Base report.
Key Features
Integrations–Gather Data from Multiple Platforms
With My Reports, you can gather data from Semrush and leading digital marketing platforms into a single, cohesive report. This allows you to track performance across all your marketing channels and see results in one convenient place.
We offer integrations with 20+ top marketing tools, including SEO, PPC, social media (paid and organic), analytics, call tracking, email marketing, e-commerce, and other key platforms.
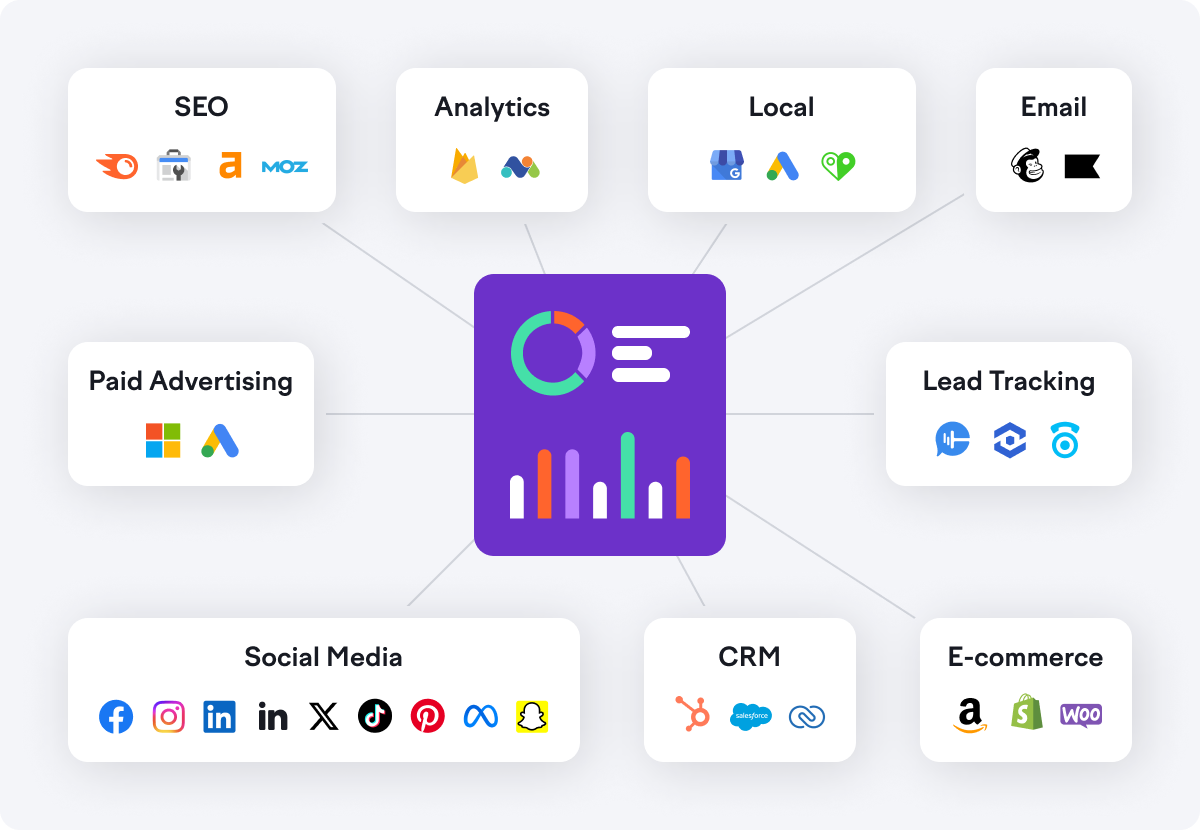
For a complete list of supported integrations and metrics, visit the My Reports Integrations page.
You can set the date for all integration widgets inside the report. This control is at the top of the report.
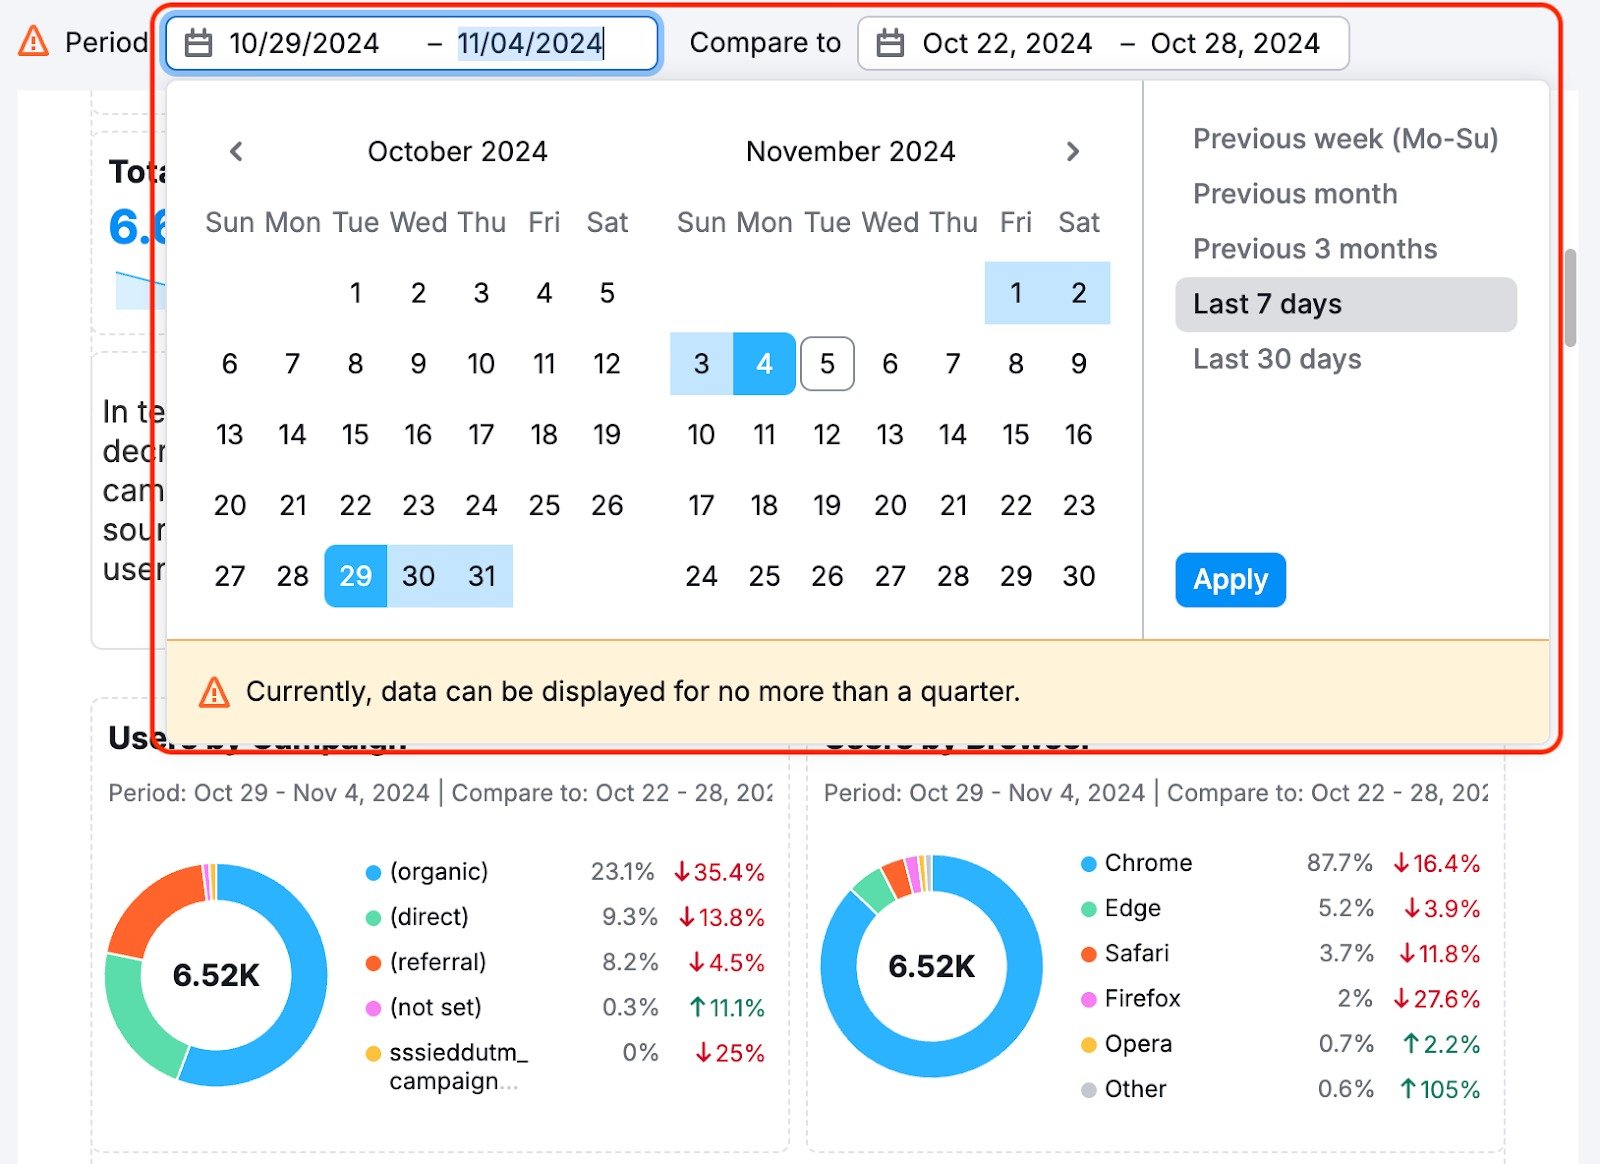
You can change the date period; all the widgets already added will change their scope. At the same time, all widgets added to the report will automatically be linked to this date.
Inside each widget’s settings, there is a setting to unlink it from the report date and manually set the dates.

Note: This feature works only with widgets from the Integrations section and does not affect widgets from the Widgets tab in the menu.
Data Visualization
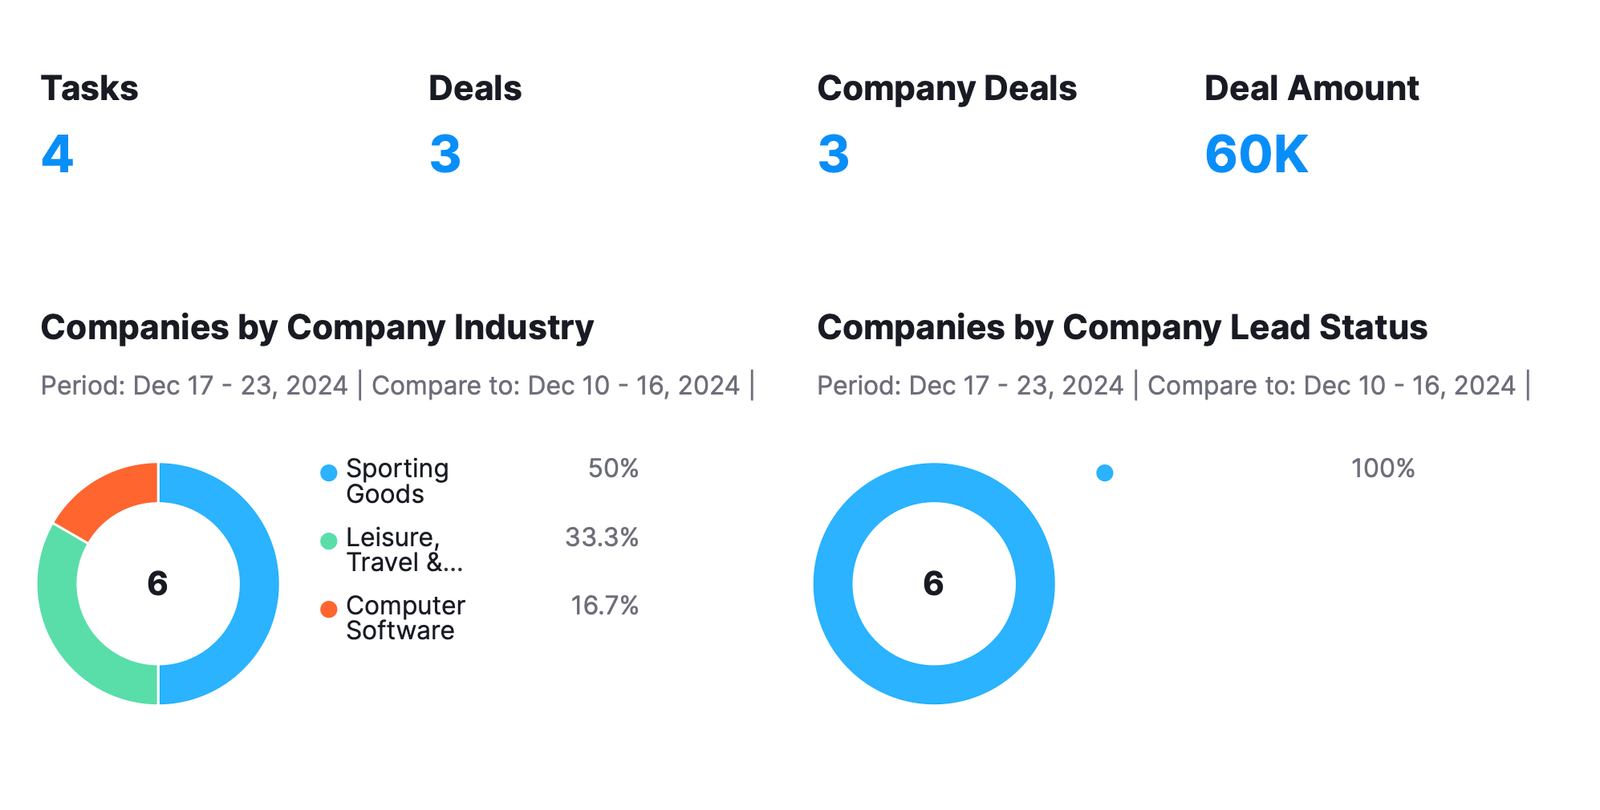
My Reports offers four data visualization formats to help you present your insights effectively:
-
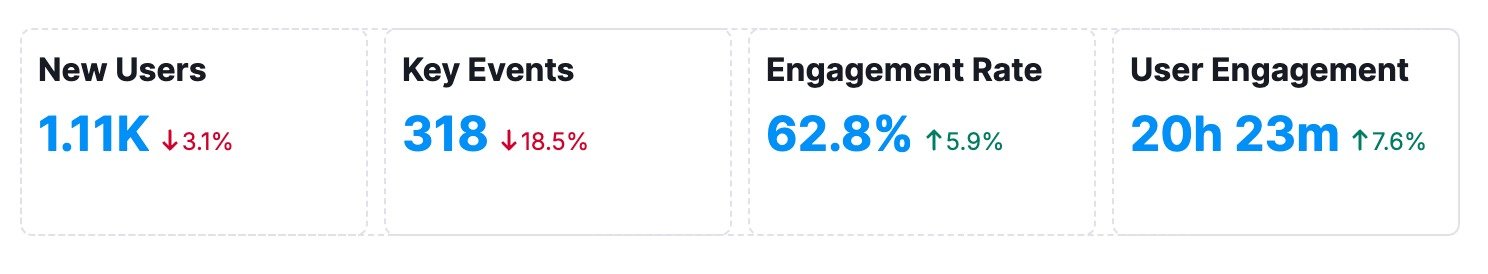
Simple Number: Ideal for showcasing key metrics like total traffic, conversions, or revenue at a glance. Perfect for emphasizing high-level KPIs.
-
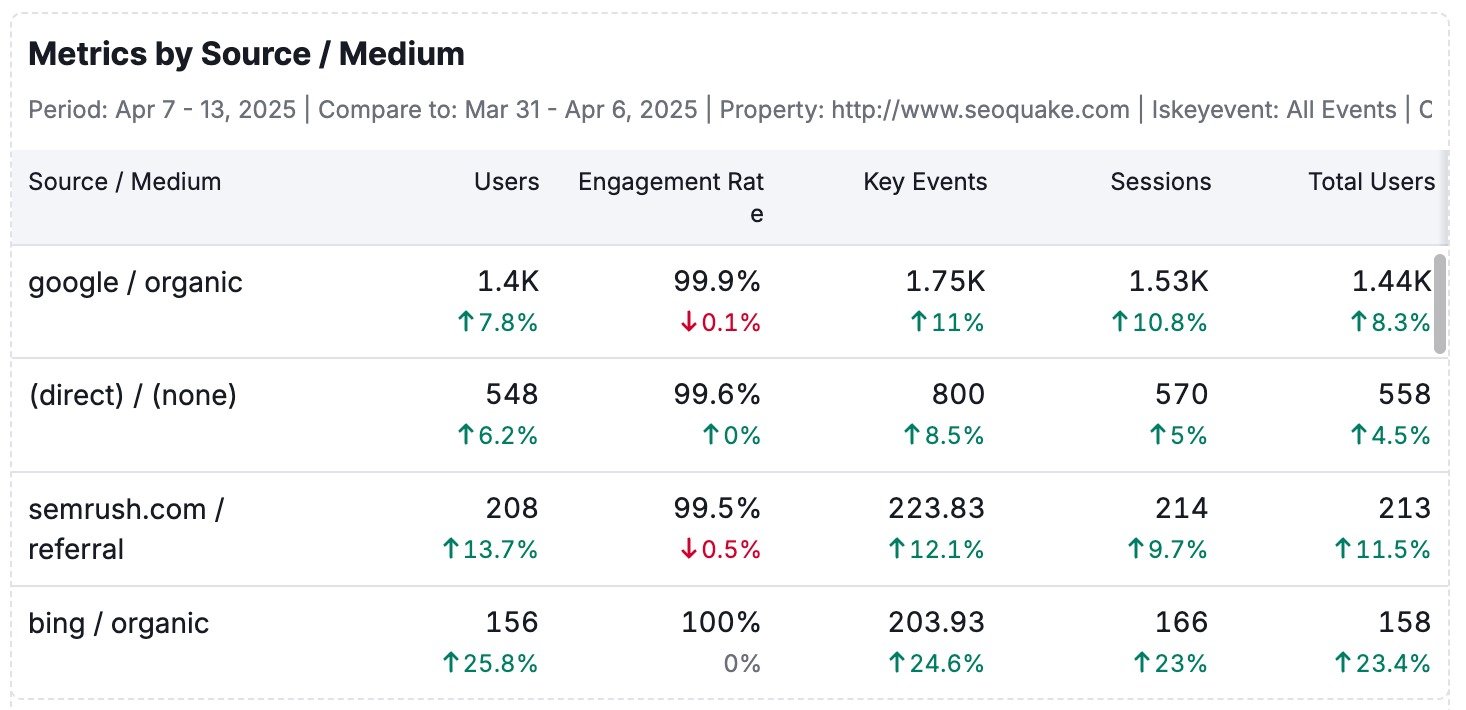
Table: Best for detailed comparisons, segmented data, or displaying granular statistics like keyword rankings, ad performance, or campaign breakdowns.
-
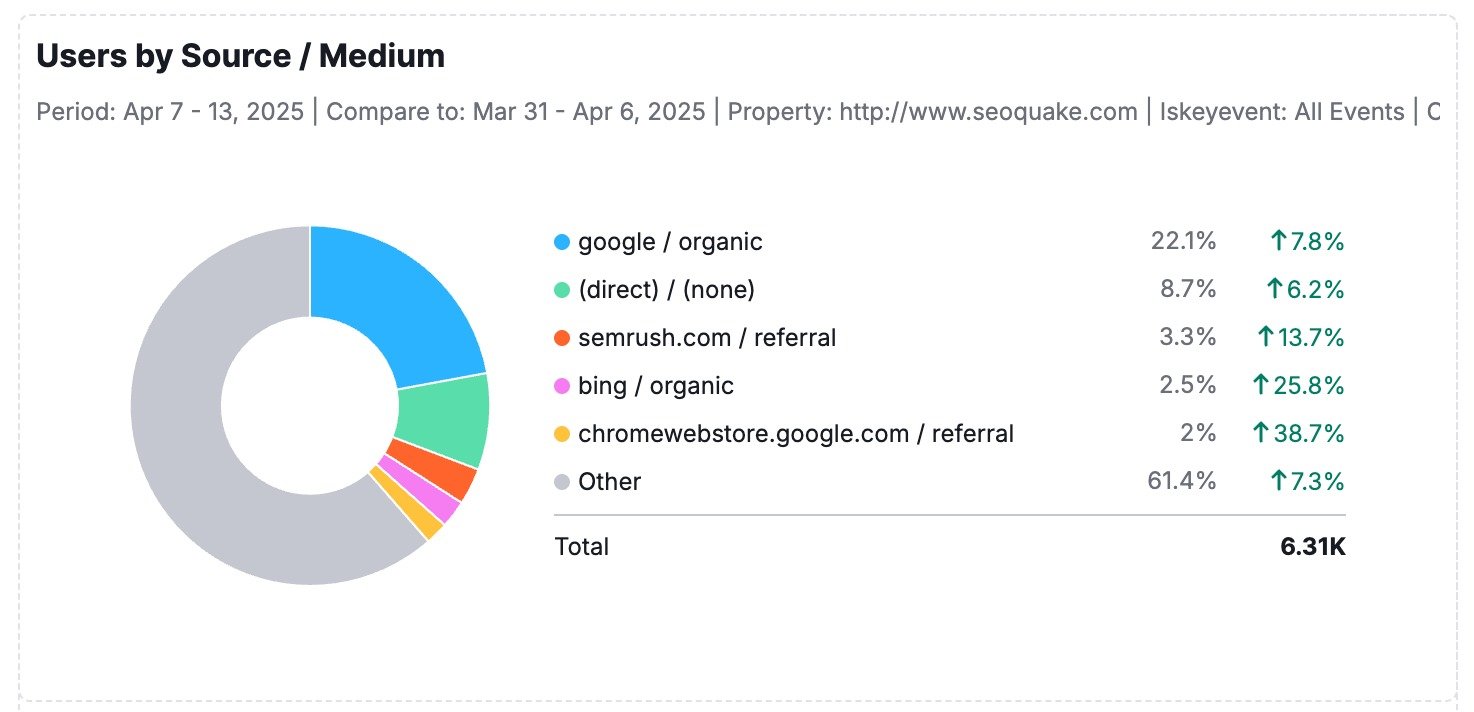
Donut Chart: This chart illustrates proportions or distributions, such as traffic sources, device usage, or budget allocation.
-
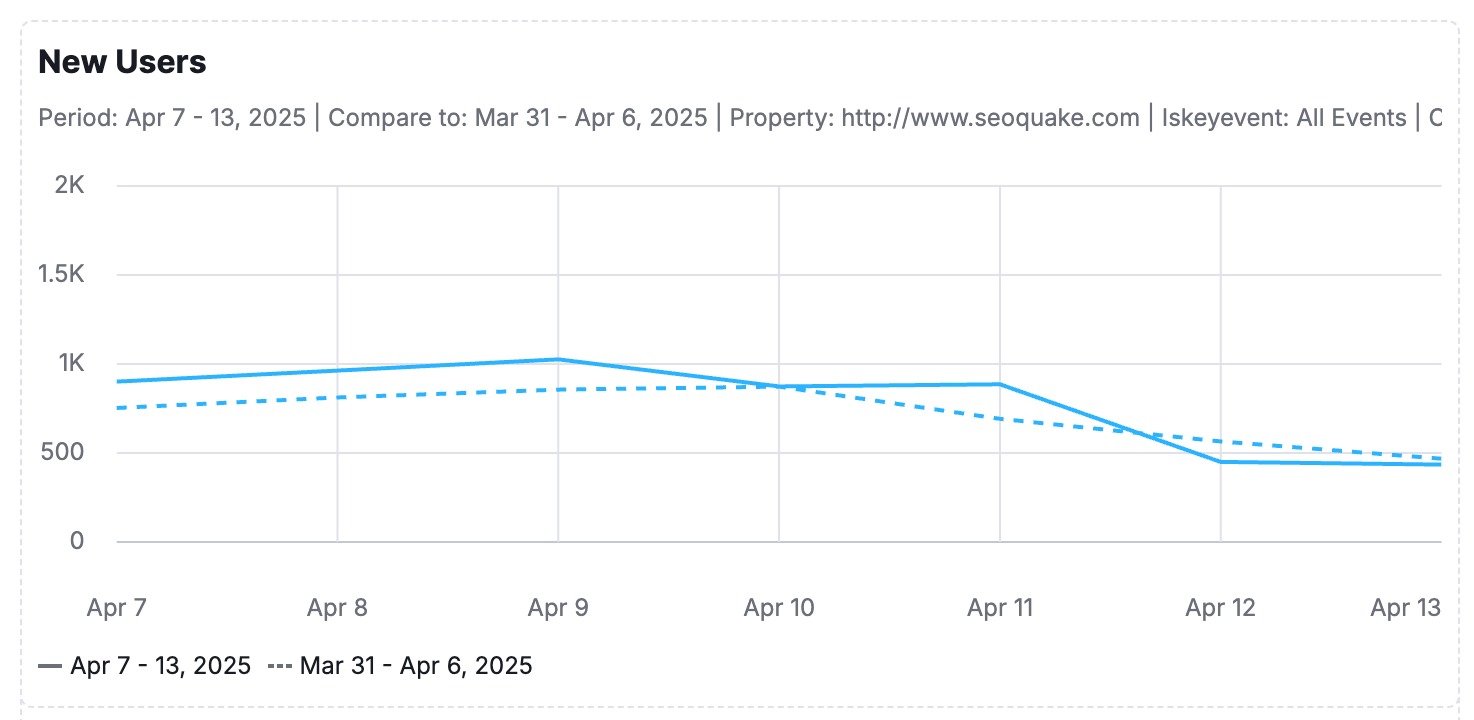
Line Chart: Perfect for tracking trends over time, such as organic growth, PPC spending, or engagement metrics.
-
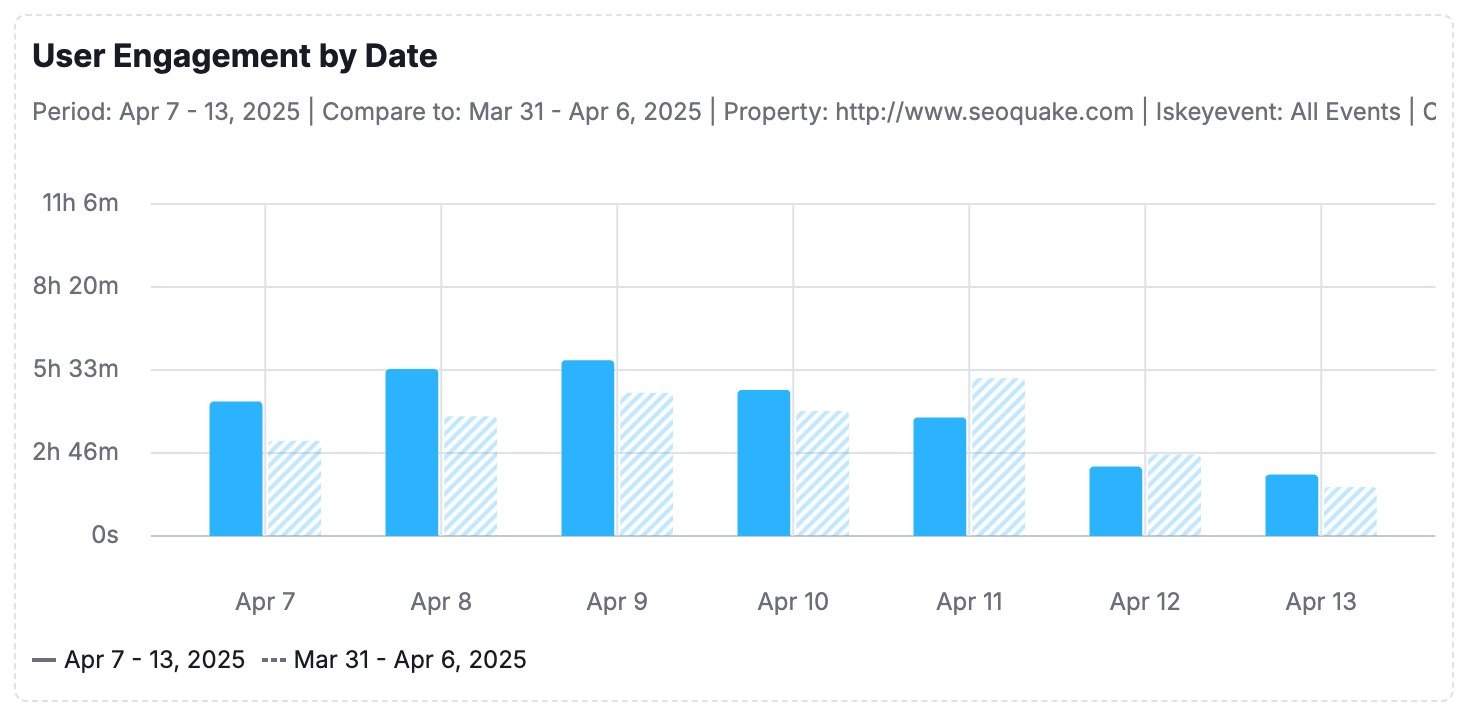
Bar Chart: Ideal for comparing values across categories. Use it to visualize performance by channel, region, campaign, or any segmented data where side-by-side comparisons reveal key insights.
Precisely select the data you want to include in your report, giving you full control to highlight the metrics that matter most to your audience.
Formatting
My Reports offers two formatting tools to help you structure and enhance your reports: Objects and Page Structure.

Formatting Options:
- Objects
Add essential elements to your report, including:- Headings for clear organization.
- Images to visually support your data.
- Text to provide context or insights.
- Page Structure
Customize your report layout with options such as:- Two-column or three-column arrangements for a clean, professional structure.
- Page breaks to segment sections or create printable versions.
AI Tools
Leverage the AI Summary widget for advanced data interpretation:
- AI Summary is available on both the Base and Pro My Reports plans.
- Use the AI Summary button at the top of your report to insert a summary, analyze all previously added widgets, and generate actionable text that effectively interprets the data.
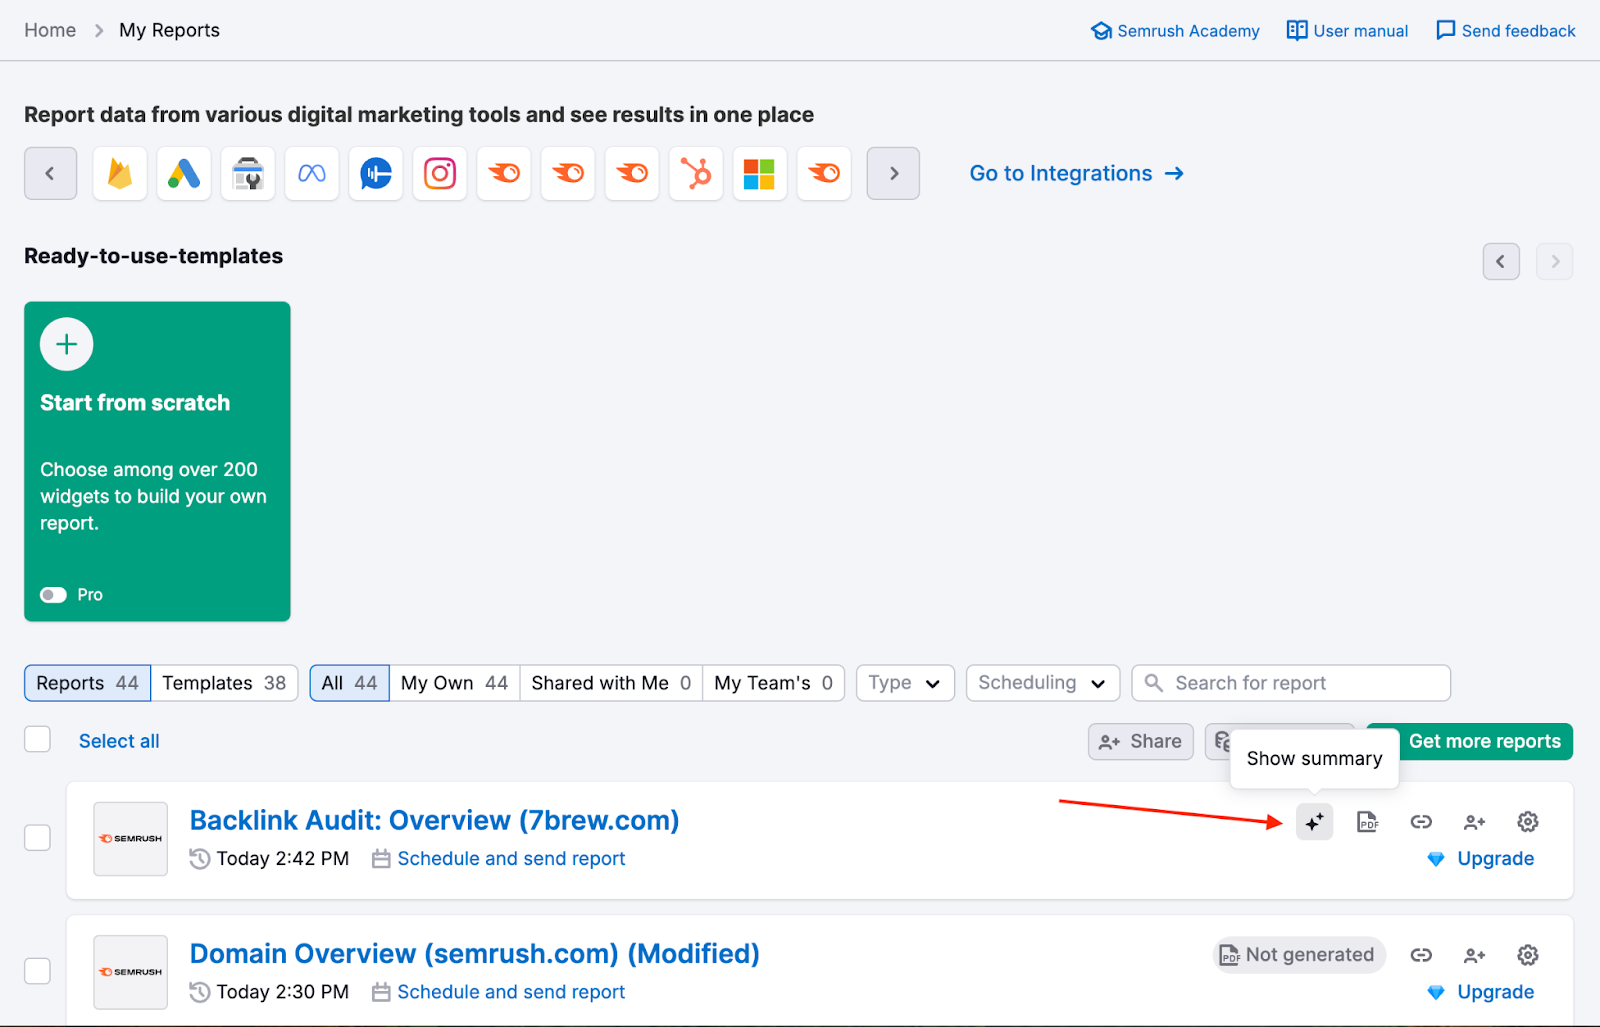
- You can access already generated summaries in seconds directly from the My Reports main page. Click the AI Summary icon (sparkle icon) next to a generated report to view the summary in a pop-up window without opening the report.
Base Report
- Base reports include a simplified version of the AI Summary feature.
- The summary for Base reports is generated using flash AI models, which provide less in-depth results compared to the Pro version.
- Customization options for these summaries are limited for Base report users.
Pro Report
- Pro reports unlock the full capabilities of the AI Summary feature, offering more in-depth results.
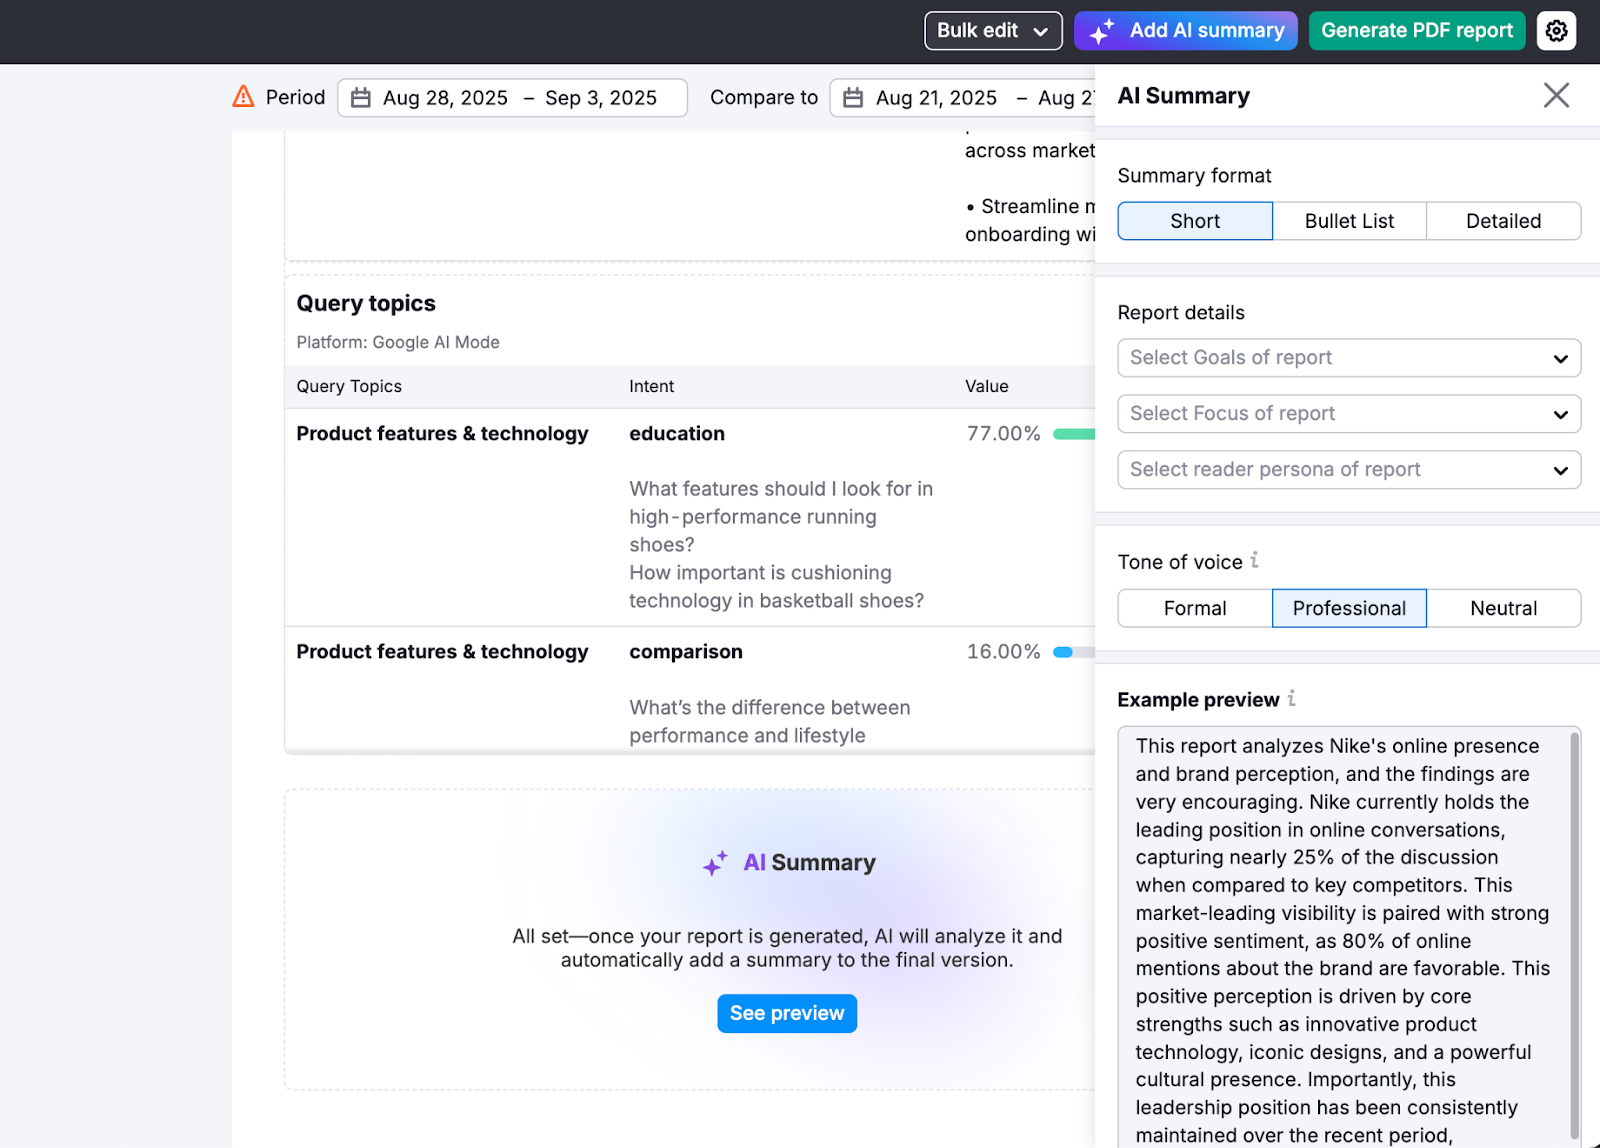
- Customization Options: To customize the report for your needs, you can choose your desired goals, focus, reader persona, and tone of voice (Formal, Professional, or Neutral).
- Summary Format: You can choose between Short, Detailed, or Bullet List summaries for flexibility in presentation.

This will help you interpret the data in your reports and give you a simple way to present your reports and draw conclusions based on them.
Report Customization
Design Themes & Styling
Customize the look and feel of your reports with branded design options. Available exclusively with Pro Reports.
With Pro Reports, you can go beyond the data and create visually polished, on-brand deliverables using powerful design tools:
- Apply pre-built design themes for quick visual consistency
- Customize colors to match your brand palette
- Add footers with legal disclaimers, contact info, or branding
- Create distinct visual styles for different clients or stakeholders.
Design customization ensures your reports look as professional as the insights they contain—perfect for client presentations or executive dashboards.
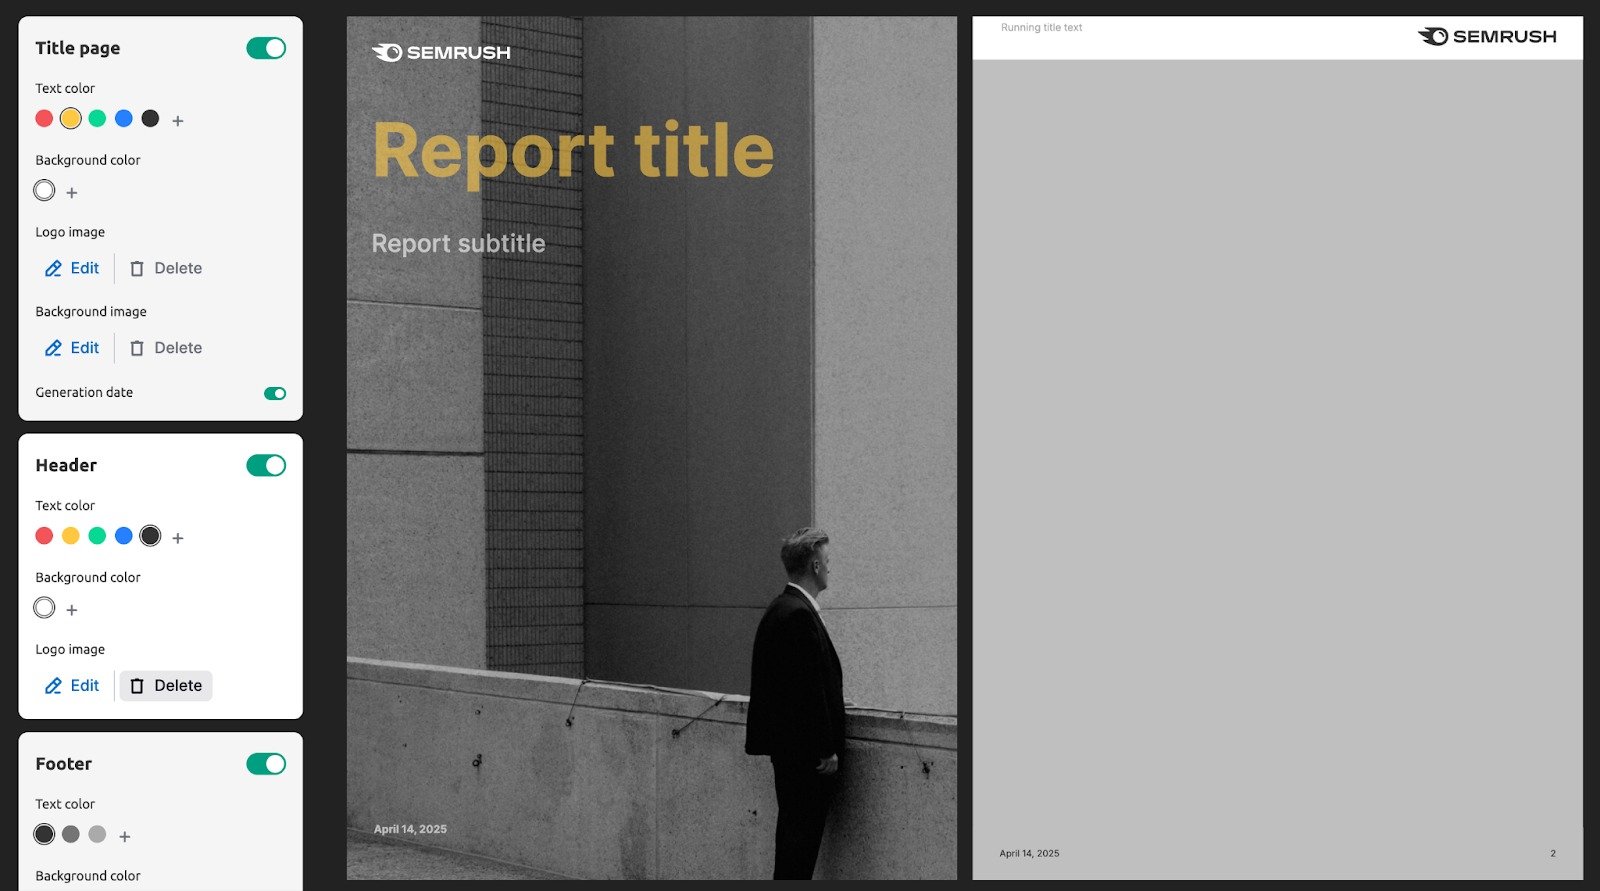
Cover Page
Add a report title and subtitle on the cover page of your report. With Pro reports, you can also benefit from the advanced customization options:
- Branding: Use a header that includes both a logo and a brief description of your brand instead of the standard Semrush logo in the header.
- White-labeling: Removal of the “The report data are taken from semrush.com” phrase. Semrush will also not be marked as a sender, and you can customize the email text when scheduling or sending the report.
- Custom themes: a set of backgrounds for your reports.
- Custom visual styles: various color schemes and font sets to choose from.
Setting a Report-Specific Locale
You can set a specific locale for each report to generate content in a language different from your Semrush account. This is ideal for tailoring reports to international clients.
Click the gear icon in the upper right corner of your report and enable the “Detach from interface language toggle.” You can then select the desired locale from the Language drop-down menu. The list of available locales matches the languages supported throughout the Semrush interface.

Note: This setting applies only to the report's content. The language of the builder interface is determined by your account settings..
Share Your Report
There are three ways to share a Report:
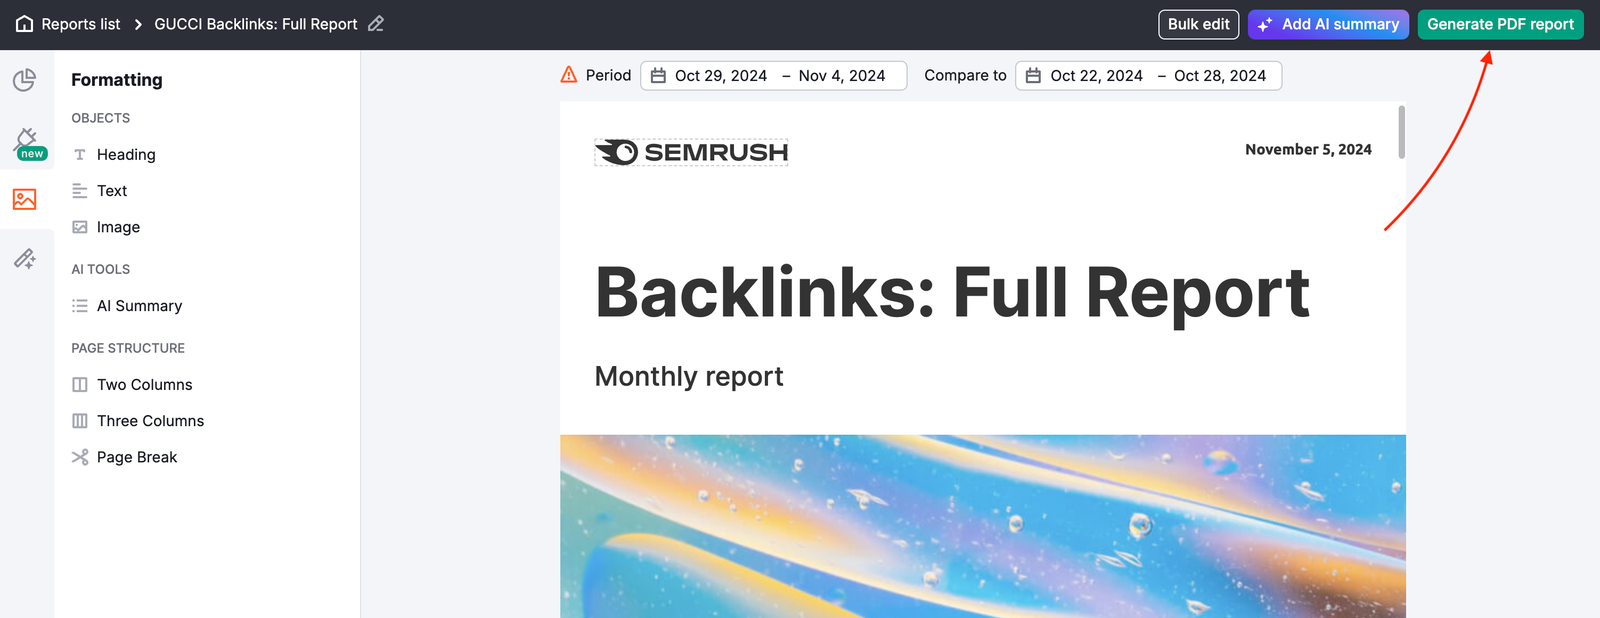
Generating a PDF Report
Generate your report and send it to your chosen email addresses. You can also automate reports through scheduled emails.
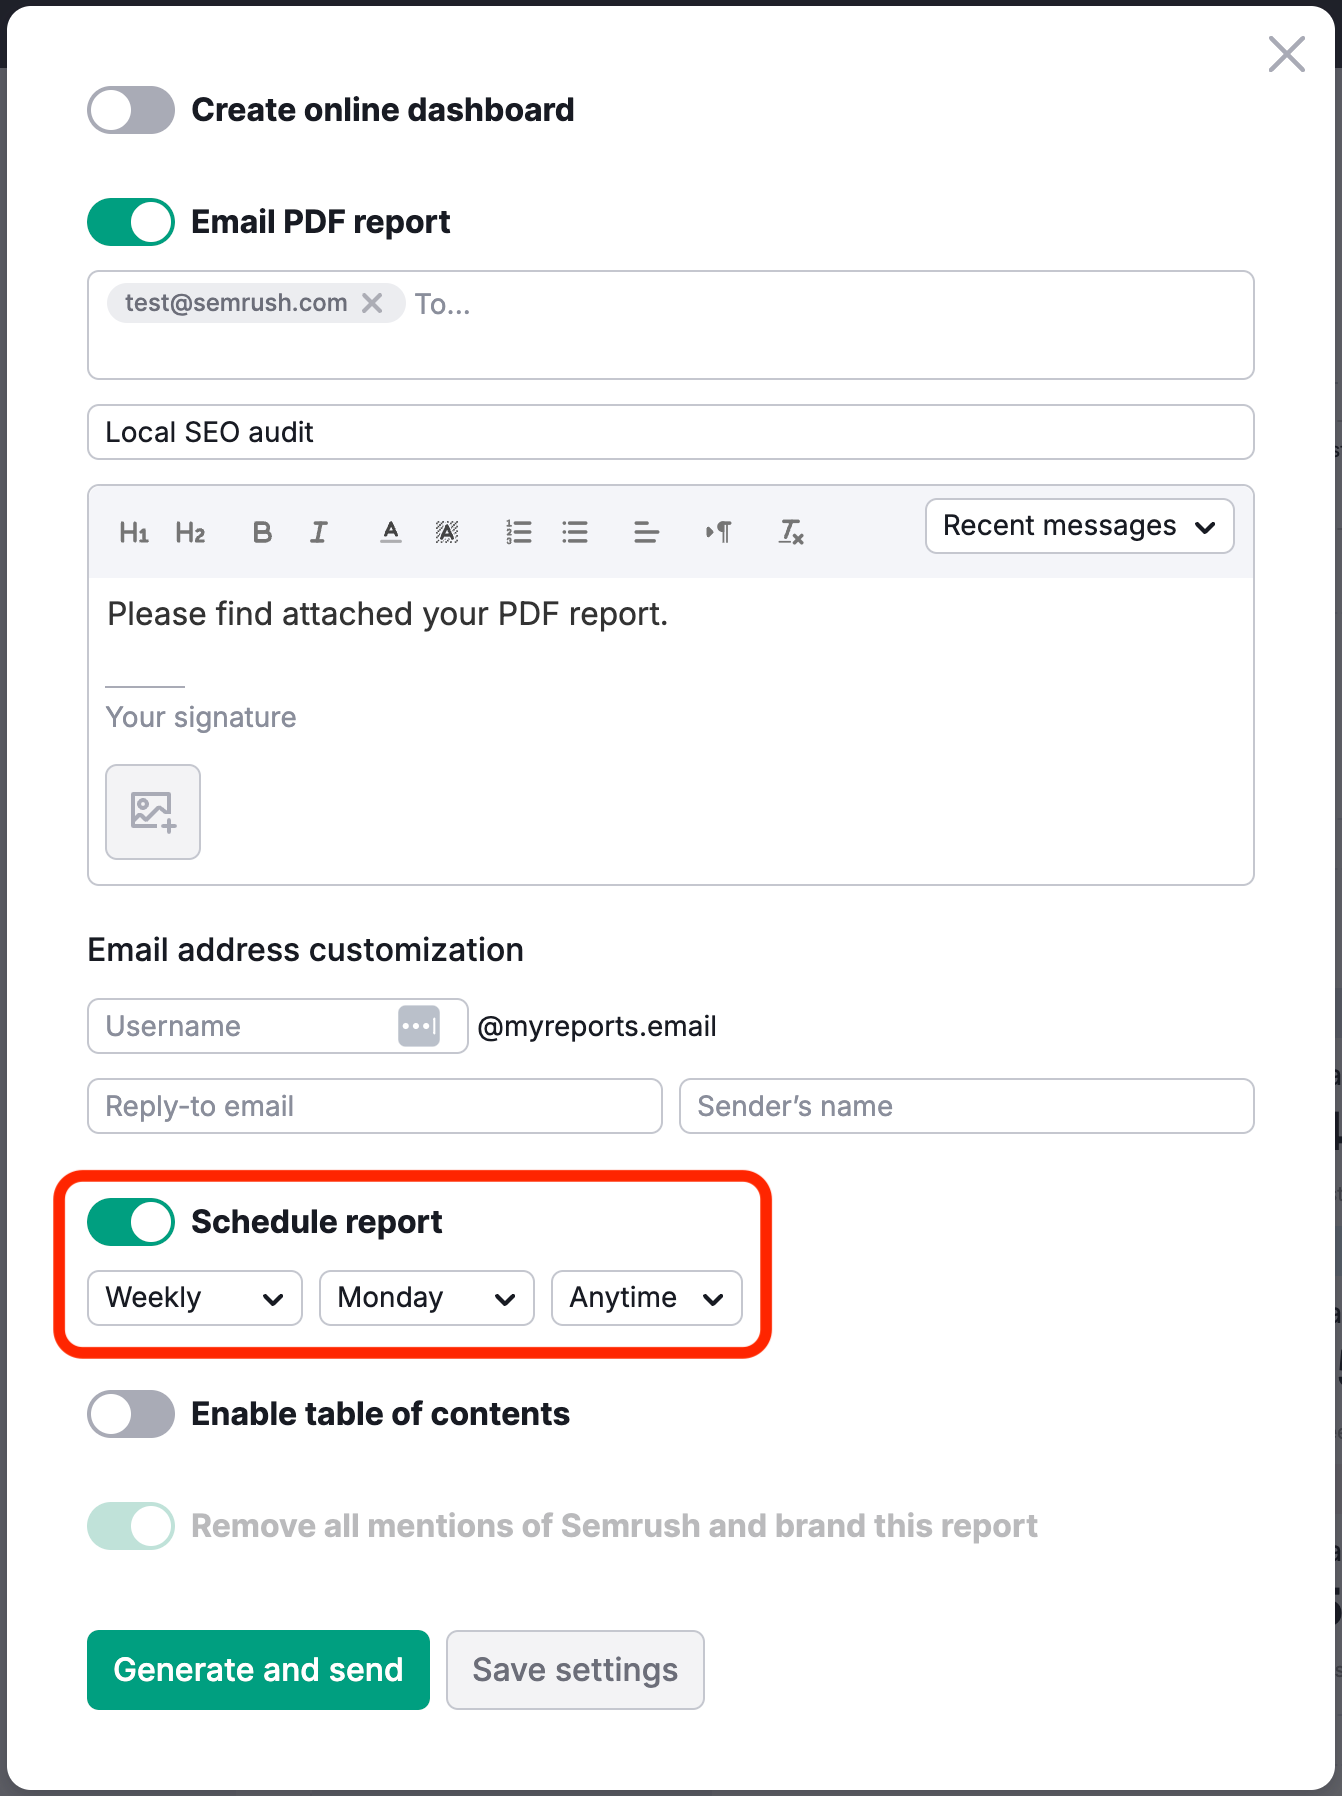
The settings allow you to set the specific email you want reports sent to and the day and frequency at which they are sent. Reports can be sent out on any day of the week and set to a daily, weekly, or monthly schedule. Scheduled reports are updated and sent out automatically on a monthly, weekly, or daily basis, as set up.
With Pro reports, you can set a specific time in the report scheduling settings.
You can also enable a table of contents from the settings menu to make your custom report easy to navigate.
Learn more about how to automate the time-consuming reporting process in the article Report Automation with Semrush.
Invite Other Users
When creating reports for marketing projects, you often need input and data from various individuals involved, such as teammates, freelance specialists, or even other agencies working with your client. This can complicate and lengthen the report creation process.
In the My Reports tool, all paid Semrush users can share reports with teammates, stakeholders, and partners, even those who have yet to create a Semrush account.
Note: You still need to create an account to access a shared report.
Now, agencies and marketing teams can work together while creating reports and providing accurate performance data across various marketing channels, ensuring everyone stays informed and up to date.
You can share reports for viewing or editing, depending on your team's specific needs.
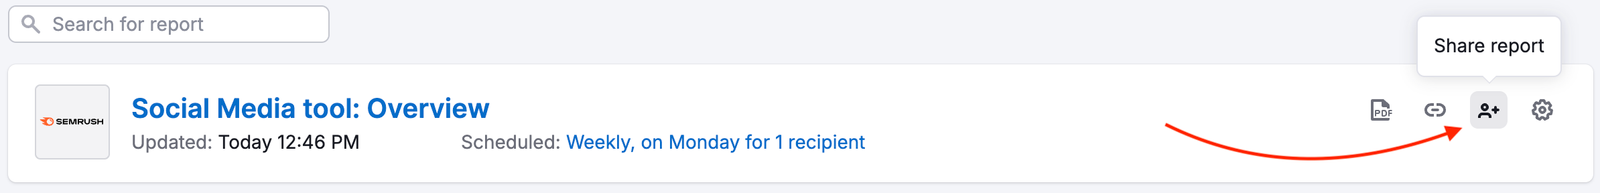
To share the report, you need to find it in your report list and click “Share report.”
Then, choose who you'd like to share it with and the access rights you want to grant them:
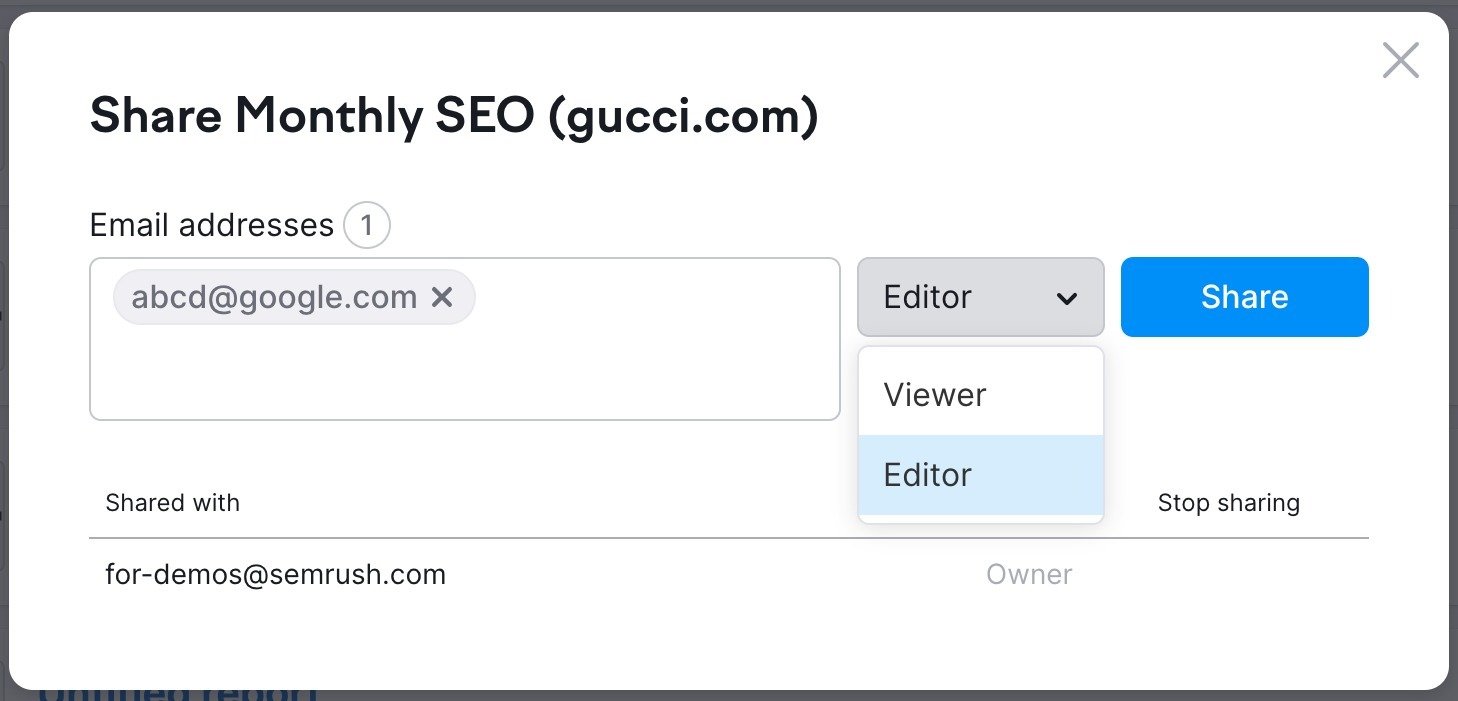
After that, a user will receive an invitation to view or edit the report (if the user doesn’t have a Semrush account, they will be prompted to create a free account).
When you share your report for viewing with others, they will have the following permissions:
- They can view the report
- They cannot edit the report settings, such as implementing white-labeling, report scheduling, custom logo and information, or design themes
- They cannot add or edit widgets in the report
- They cannot view the report-sharing settings or share the report with others
- They can use the shared report as a template for their own report
- They can clone the shared report and edit the new copy.
If you share your report for editing with others, they will have the ability to:
- Edit the report settings, including implementing white-labeling, report scheduling, custom logo and information, and design themes
- View all the widgets in the report
- Delete any widgets in the report
- Add widgets that are available with their Semrush plan
- Edit the widgets they have added
- View the sharing settings and share the report with others
- Change any widget (even if it was added by someone else)
- They can use the shared report as a template for their report
- They can clone the shared report and edit the new copy.
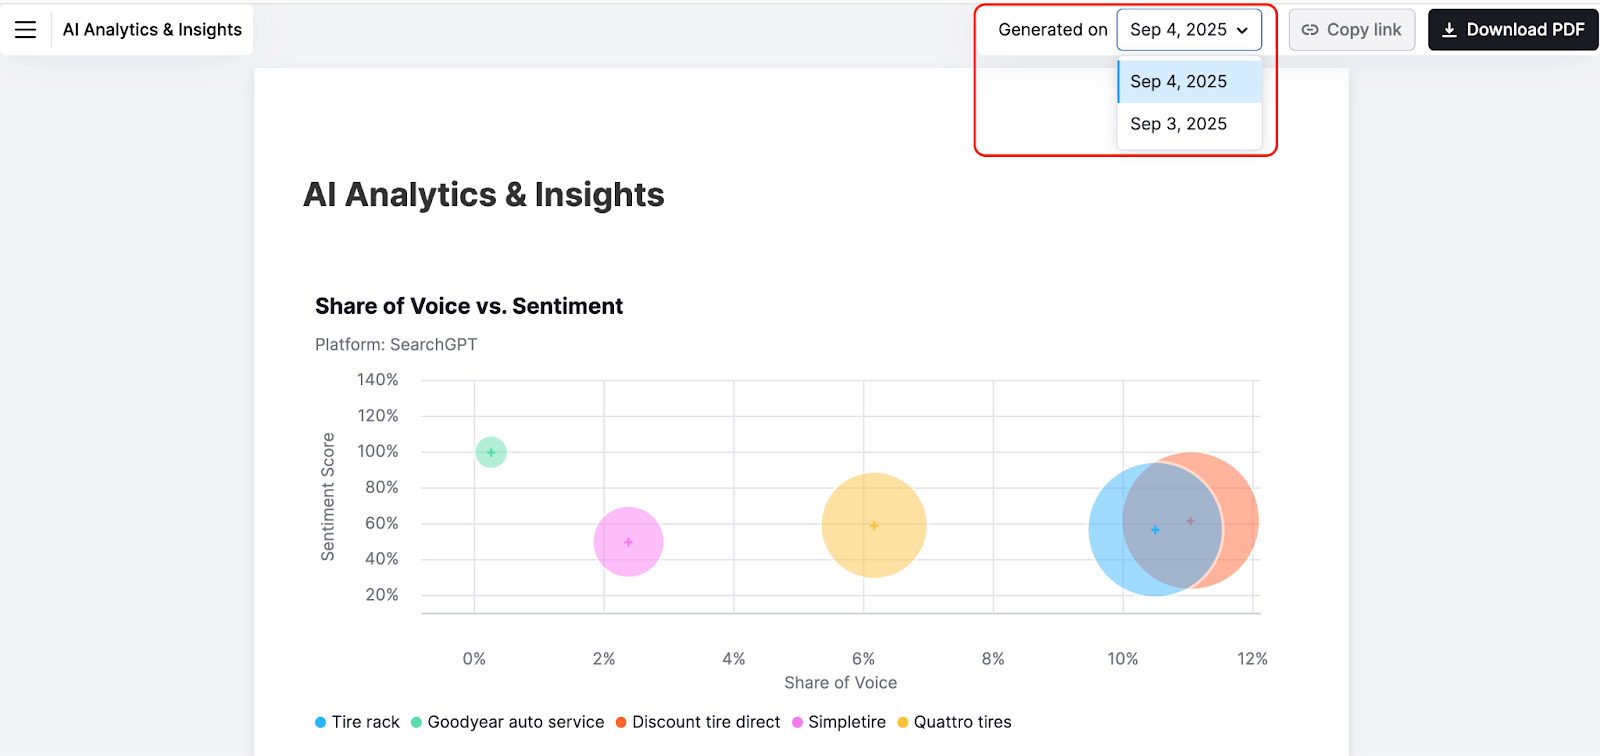
Online Dashboards
* Available with Pro reports
Generate a public link to a dashboard based on your generated PDF report. This feature makes sharing insights easier and more accessible, ensuring data is always up-to-date and shareable with a simple link.
In addition to sharing this link directly, you can embed the live dashboard into your own website, blog, or client portal using an iframe. This allows you to visually integrate your Semrush data for a seamless experience.
The dashboard's data will automatically refresh according to the report auto-generation schedule. You can also update the data manually whenever needed.
Switch between different report generation dates in the dashboard for a flexible viewing experience.